Summary
The Software-as-a-Service (SaaS) has globally risen so much that it enters into a paradoxical phase but with growing at macro level it is still overcrowded at micro level. The SaaS market is projected to exceed $267.94 billion in 2026 to $800 billion by 2030 . But still with this the competition among horizontal SaaS has been reached to a striking level. This report analyses the Market penetration, TAM( Total Addressable Market) and Competitive Moats. This paper will identify the blue oceans sectors such as Agri-Tech, Mining SaaS and Logistic Infrastructure Platforms. By using the recent industry data and research backed insight, this paper provides founders and investors a strategic framework. This paper will uncover the untapped SaaS opportunities.
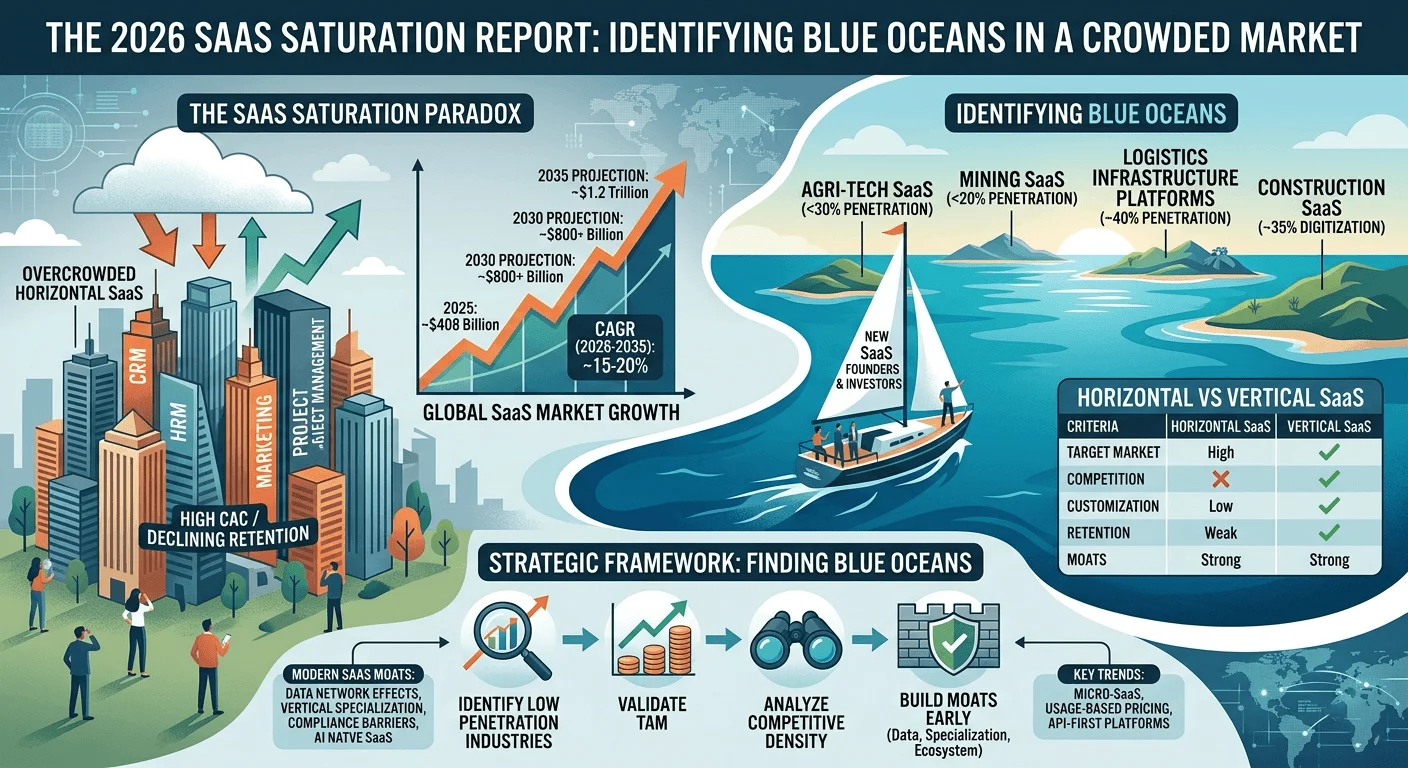
The 2026 SaaS Saturation Report: Identifying Blue Oceans in a Crowded Market

The SaaS Saturation Paradox
In 2026 the SaaS ecosystem is in a situation where it is unique and confusing. One side is rapidly increasing at industrial level. The global market projected that it will grow to ~15% CAGR ( Compound Annual Growth Rate) reaching over $1 trillion by 2035. This shows a strong demand for cloud based software.
While on the other hand, the SaaS saturation occurs in some popular categories. These categories include Customer Relationship Management (CRM), Human Resource Management (HRM), and project management tools. In these SaaS products there are already hundreds of competitive companies offering similar solutions. So, it is very difficult for new companies to stand out in the SaaS industry or succeed.
Understanding the Key paradox
This situation creates a contradiction like most businesses (80-99%) already use SaaS tools which means the market is highly developed and widely adopted. But still some companies only use 47% of the software for which they pay. This means that tools are unnecessary, underused or overlapping.
So, the problem is not the lack of software, the problem is that there is a lot of similar software in the same region. Which shows that companies now look for more efficient tools that are fully usable. As a result the market is shifting to ward Vertical SaaS from Horizontal SaaS.
Global SaaS Market Overview
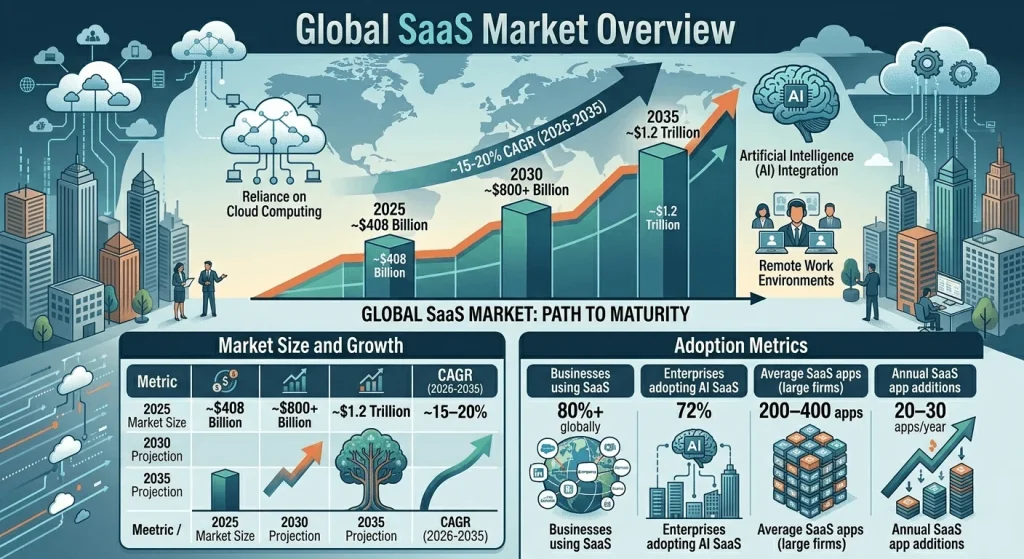
The SaaS industry is growing globally due to reliance on cloud computing, artificial intelligence(AI) and remote work environments. SaaS solutions are being adopted at an unmatched level in business across the world. This shows a sign of market maturity and makes it a critical component of modern digital infrastructures.
Market Size and Growth
The following table highlights the rapid expansion of the global SaaS market. This will show current valuation, future projections, and expected compound annual growth rate over the next decade.
| Metric | Value |
| 2025 Market Size | ~$408 Billion |
| 2030 Projection | ~$800+ Billion |
| 2035 Projection | ~$1.2 Trillion |
| CAGR (2026–2035) | ~15–20% |
Adoption Metrics
Most companies now rely on SaaS tools that show how common they’ve become. Usage trends pop up everywhere, often tied to new AI features tucked inside apps. More programs get added each year, yet many sit barely touched.
| Indicators | Statistic |
| Businesses using SaaS | 80%+ globally |
| Enterprises adopting AI SaaS | 72% |
| Average SaaS apps (large firms) | 200–400 apps |
| Annual SaaS app additions | 20–30 apps/year |
Understanding SaaS Saturation
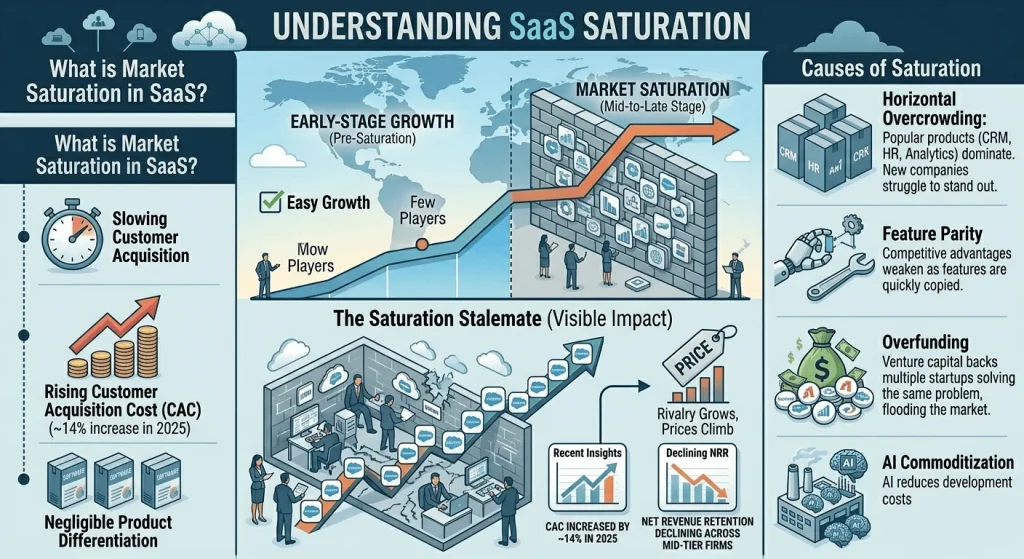
When lots of people use a SaaS but growth still stalls, that is saturation. Rivalry grows fiercer yet prices climb, making it harder to stand out. Nearly identical offerings flood the space, so fresh players struggle more than before. Crowded fields show their limits; newcomers hit walls faster now.
What is Market Saturation in SaaS?
Market Saturation occurs when:
- Customer acquisition slows
- Customer acquisition cost (CAC) rises
- Product differentiation becomes negligible
Recent industry insights show:
- CAC increased by ~14% in 2025
- Net revenue retention is declining across mid-tier SaaS firms
Causes of Saturation
1. Horizontal Overcrowding
Some popular products of SaaS like CRM, HR, and analytics dominate the industry market. But these similar tools make it difficult for new companies to stand out in the market.
2. Feature Parity
Now it has become very difficult to build a strong competitive advantage or moat. As competitors quickly copy features reducing differentiation.
3. Overfunding
Venture capital often backs multiple startups solving the same problem. This creates flooding the market and creates intense competition.
4. AI Commoditization
AI reduces development costs, making it easier for new companies to enter. While this increases innovation, it also intensifies competition and drives down uniqueness.
Market Penetration Analysis
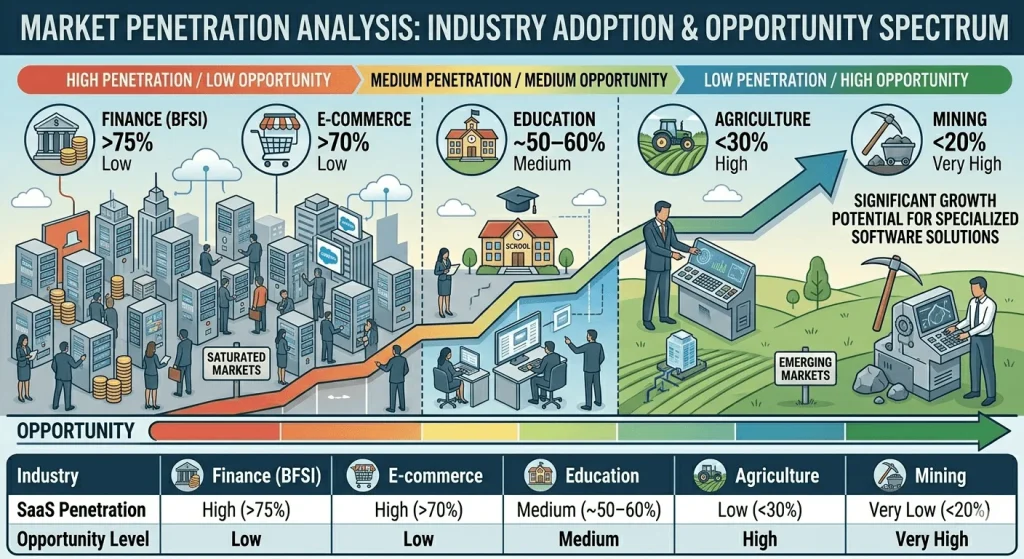
SaaS adoption varies widely across industries. Highly digitized sectors are saturated, while traditional industries like agriculture, mining, and construction lag behind, offering significant growth potential for specialized software solutions.
High vs Low Penetration Industries
| Industry | SaaS Penetration | Opportunity Level |
| Finance (BFSI) | High (>75%) | Low |
| E-commerce | High (>70%) | Low |
| Education | Medium (~50–60%) | Medium |
| Agriculture | Low (<30%) | High |
| Mining | Very Low (<20%) | Very Hight |
TAM (Total Addressable Market) in Vertical SaaS
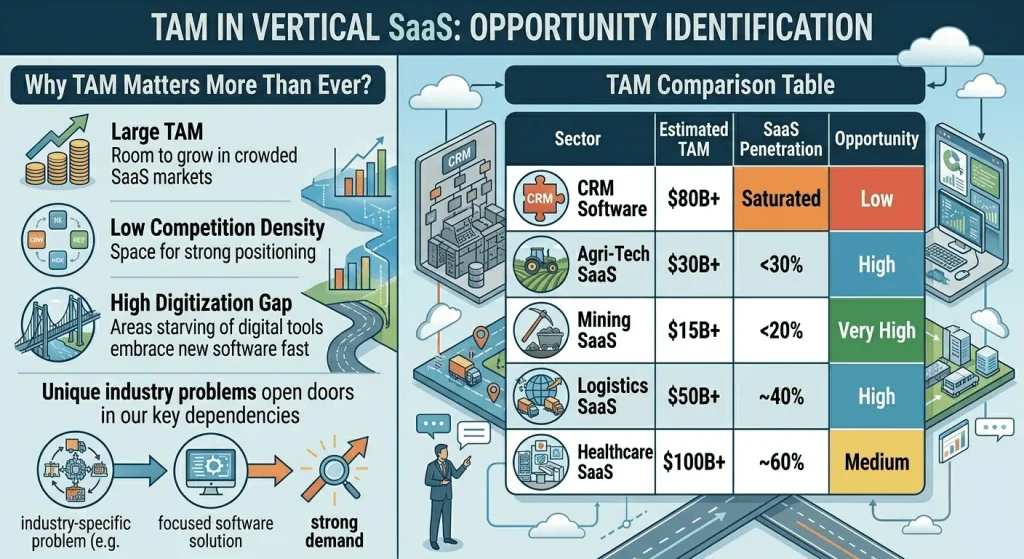
A single industry’s unique problems open doors for focused software solutions, sparking strong demand where needs are overlooked. When firms measure how much room exists to grow, choices about where to act become clearer. Some areas offer rich income prospects, face few rivals, yet lag behind in tech adoption – making them stand out. These insights shape what gets built, how it reaches users, why certain paths support lasting scale
Why TAM Matters More Than Ever?
A big TAM hints at room to grow in crowded SaaS markets. Where few players compete, space opens up for stronger positioning. Areas starved of digital tools tend to embrace new software fast, letting companies scale without dragging momentum. In saturated markets, success depends on:
- Large TAM
- Low competition density
- High digitization gap
TAM Comparison Table
| Sector | Estimated TAM | SaaS Penetration | Opportunity |
| CRM Software | $80B+ | Saturated | Low |
| Agri-Tech SaaS | $30B+ | <30% | High |
| Mining SaaS | $15B+ | <20% | Very High |
| Logistics SaaS | $50B+ | ~40% | High |
| Healthcare SaaS | $100B+ | ~60% | Medium |
Blue Ocean Opportunities (Under-Digitized Markets)
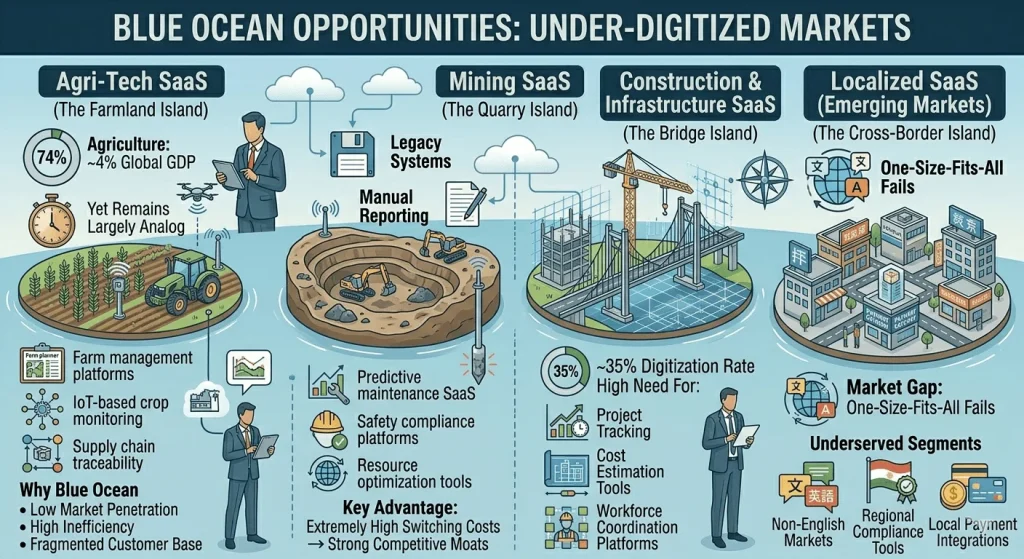
Out there, plenty of fields still rely on old methods, leaving wide-open spaces where tech tools could speed things up big time. Where few digital fixes exist, operations often drag, and buyers are scattered – a spot that suits subscription software well. These corners let companies build staying power quietly, growing steadily without drawing attention from bigger players stuck elsewhere.
Agri-Tech SaaS
Farming stays huge but lags behind in digital tools. As growers face tougher demands on crop tracking, logistics, and daily hazards, new openings emerge – not through flashiness, instead via focused software that simply works better than old ways.
Market Dynamics
- Agriculture contributes ~4% of global GDP
- Yet remains largely analog
Opportunities
- Farm management platforms
- IoT-based crop monitoring
- Supply chain traceability
Why It’s a Blue Ocean
- Low Market Penetration
- High inefficiency
- Fragmented customer base
Mining SaaS
Older tech and hands-on methods still run most mining SaaS. When digital tools step in, they tidy up repairs, boost worker protection, steps ahead in using materials wisely – opening doors for software services to gain ground in a tough yet rewarding field
Market Gap
Mining operations still rely on:
- Legacy systems
- Manual reporting
Opportunities
- Predictive maintenance SaaS
- Safety compliance platforms
- Resource optimization tools
Key Advantage
Extremely high switching costs → strong Competitive Moats
Construction & Infrastructure SaaS
Even now, building things stays mostly hands-on, just about 35 percent digital. Yet software you rent online helps teams follow progress, guess costs better, and also manage workers more smoothly. This fixes weak spots across job sites everywhere, bringing clear upgrades in how work gets done around the globe
- Only ~35% digitization rate
- High need for:
- Project tracking
- Cost estimation tools
- Workforce coordination platforms
Localized SaaS (Emerging Markets)
Outside big tech’s reach, new markets wait quietly. Where people speak different languages, one-size-fits-all software often fails. Rules about data and privacy shift from place to place. Payment habits also differ – what works in one country feels strange in another. Software built close to home gains trust faster. By the time large companies notice, smaller players may already own the space
Underserved segments:
- Non-English markets
- Regional compliance tools
- Local payment integrations
Competitive Moats in 2026 SaaS
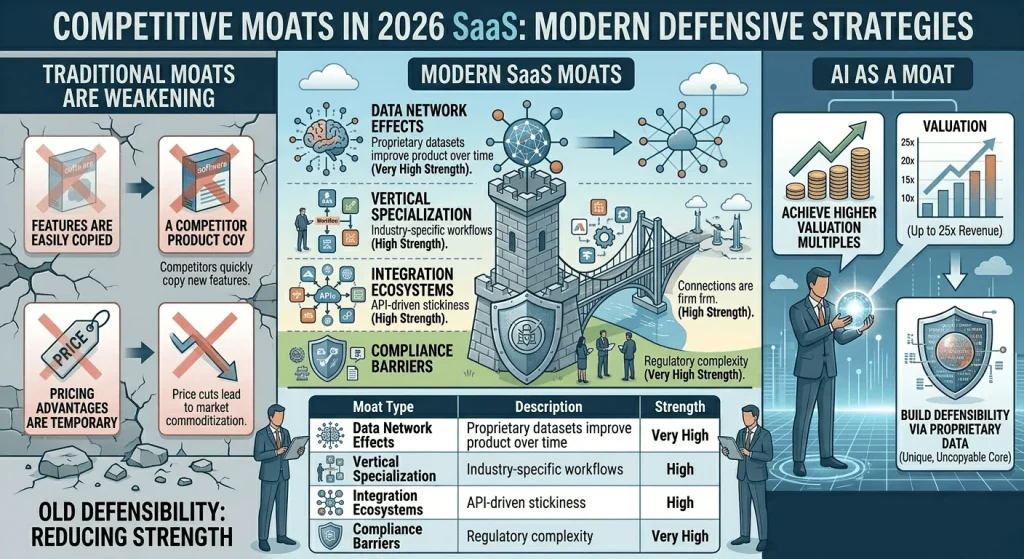
When SaaS markets grow older, old ways of staying ahead start fading. Staying strong means digging deeper into what others can’t copy. Data that grows smarter with more users helps. Focusing tightly on one industry works too. Linking closely with other tools adds weight. Meeting strict rules keeps some out. Smarter software powered by AI shapes lasting edges. Value sticks around when tech learns faster than rivals.
Traditional Moats Are Weakening
- Features are easily copied
- Pricing advantages are temporary
Modern SaaS Moats
| Moat Type | Description | Strength |
| Data Network Effects | Proprietary datasets improve product over time | Very High |
| Vertical Specialization | Industry-specific workflows | High |
| Integration Ecosystems | API-driven stickiness | High |
| Compliance Barriers | Regulatory complexity | Very High |
AI as a Moat
AI-native SaaS companies:
- Achieve higher valuation multiples (up to 25x revenue)
- Build defensibility via proprietary data
Vertical SaaS: The Future of Market Expansion

Focused on single industries, vertical SaaS changes how software works. Instead of one-size-fits-all tools, it fits exactly what a business does. Because it matches real tasks, people stick with it longer. Rules and compliance? Built right in. It connects smoothly with systems already in place, skipping clunky workarounds.
Niche markets respond better when the tool speaks their language. While general platforms scatter attention, these stay sharp. High-value clients notice the difference quietly. Growth comes not from reach but depth. Performance climbs where specialization replaces breadth.
Vertical SaaS accounted for:
- ~30% of new SaaS products in 2024
Growth drivers:
- Industry-specific workflows
- Regulatory requirements
- Custom integrations
Horizontal vs Vertical SaaS
| Criteria | Horizontal SaaS | Vertical SaaS |
| Target market | Broad | Niche |
| Competition | High | Low |
| Customization | Low | High |
| Retention | Medium | High |
| Moats | Weak | Strong |
Strategic Framework: Finding Blue Oceans
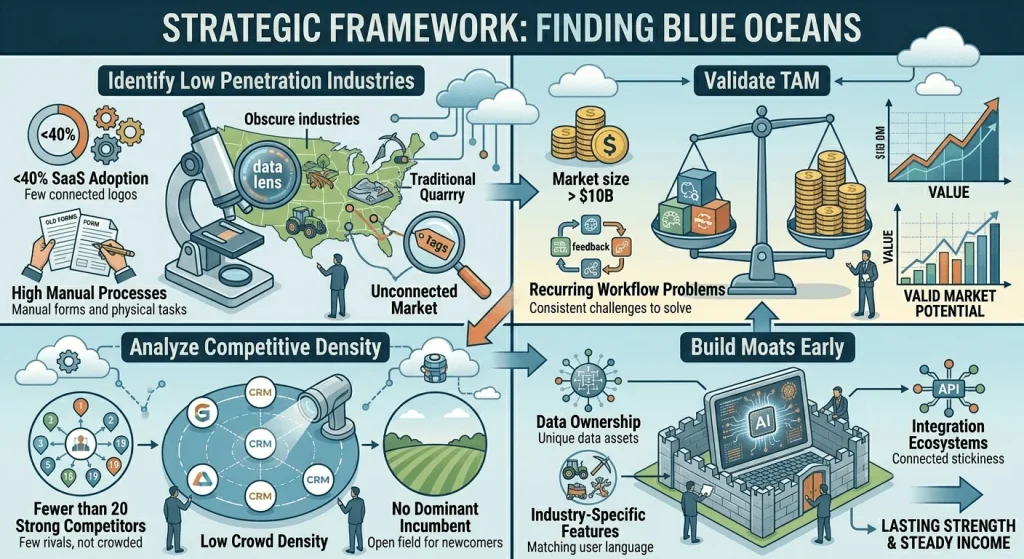
Start by looking where others aren’t. Firms should turn attention toward industries with little digital adoption, then check if those spaces offer big enough demand. Instead of guessing, measure how crowded they are with rivals. Build strong protections early, not after launch. Mix these moves together, and software companies begin finding spots full of potential. They craft offerings that stand apart. A head start grows into lasting strength. Quiet areas, once ignored, feed steady income over time.
Step 1: Identify Low Penetration Industries
Look for sectors with:
- <40% SaaS adoption
- High manual processes
Step 2: Validate TAM
Ensure:
- Market size > $10B
- Recurring workflow problems
Step 3: Analyze Competitive Density
- Fewer than 20 strong competitors
- No dominant incumbent
Step 4: Build Moats Early
- Data ownership
- Industry-specific features
- Integration ecosystems
Key Trends Shaping SaaS in 2026
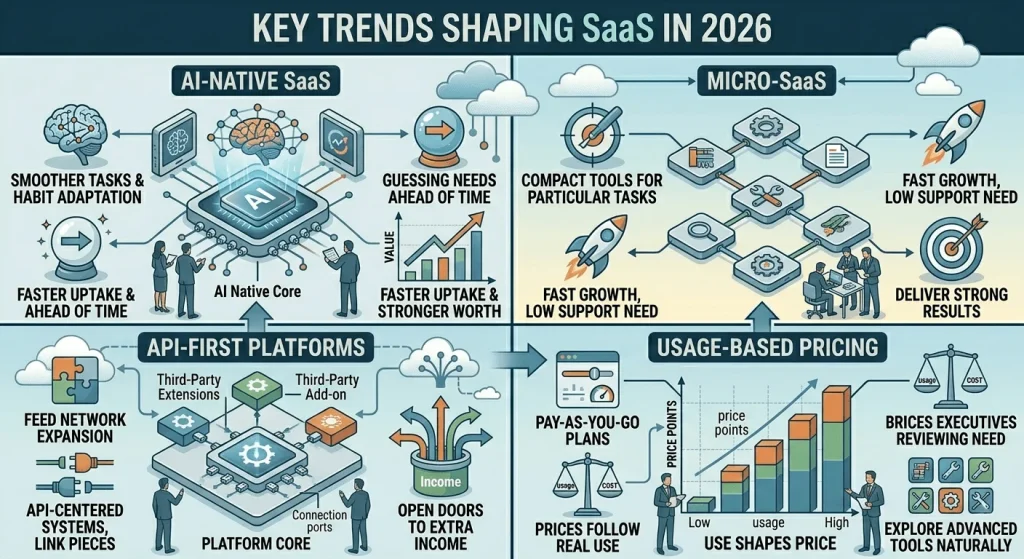
Software keeps shifting, new tech pushes it forward, people want different things now, and companies try fresh ways to run their services. What you build today changes how it’s made, shared, even paid for tomorrow.
1. AI-Native SaaS
Software now comes built with artificial intelligence (AI Native SaaS), making tasks run smoother while adapting to user habits and guessing needs ahead of time. Firms using these smart tools right inside their systems notice faster uptake plus stronger market worth.
2. Micro-SaaS
A shift is happening toward compact tools built for very particular tasks. These tiny tech services grow fast without needing much support, yet deliver strong results where it counts. Their strength lies in focusing on one thing, doing it well in micro SaaS.
3. API-First Platforms
Starting fresh each time, API-centered systems link pieces without hiccups while feeding network expansion. With that setup, outside builders craft add-ons that stretch what the system can do, opening doors to extra income.
4. Usage-Based Pricing
Now comes a change where SaaS companies trade fixed fees for pay-as-you-go plans. When prices follow real use, people feel they get what they deserve while exploring advanced tools feels more natural. This one keeps repeating itself – use shapes price
Risks and Challenges
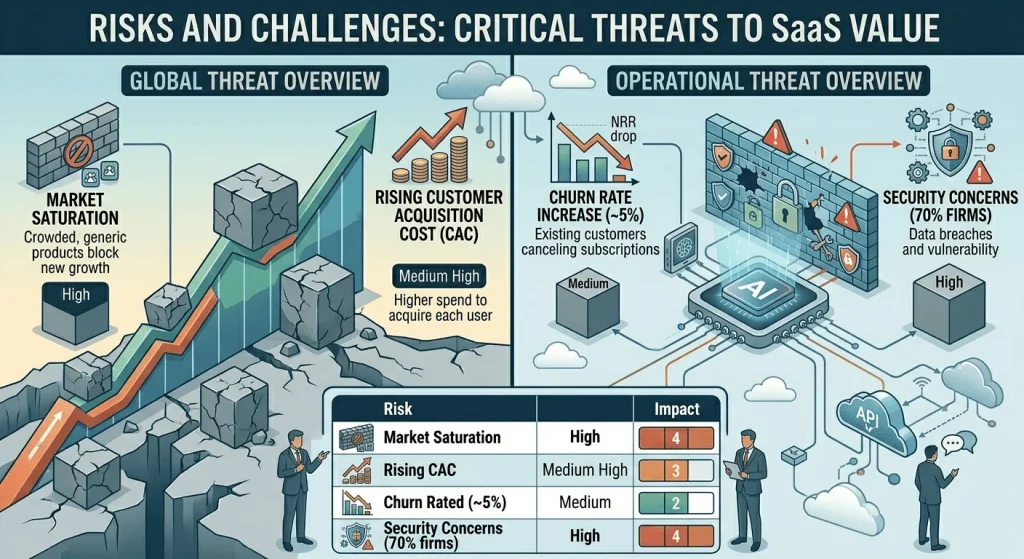
| Risk | Impact |
| Market saturation | High |
| Rising CAC | Medium high |
| Churn rated (~5%) | Medium |
| Security concerns (70% firms) | High |
Publish Your Research with SaaS and Systems Journal
Right now, lots of people are offering similar SaaS tools, so getting noticed means showing up where others do like in SaaS and journals. Posting through SaaS networks spreads ideas fast, whereas journals lend weight over time with peer-reviewed backing. Experts who do both tend to stand out when talking about market reach or total audience size.
Conclusion
One step ahead in 2026, SaaS isn’t focused on sharper software instead, it targets smarter places to sell. Hidden giants won’t rise from tech hubs packed with rivals, think farms, quarries, or small-town economies instead. While others chase trends, growth hides where few look.